This guide covers the platform-based workflow. If you prefer to generate inferences programmatically (e.g., in a CI/CD pipeline or custom script), see the SDK tutorials instead.
Prerequisites
Before you begin, make sure you have the following set up in the Galtea Dashboard:- A Product representing your AI system
- A Test with at least one Test Case to run against your endpoint
Workflow Overview
Create an Endpoint Connection
Define how Galtea should call your AI endpoint — URL, authentication, request format, and response extraction.
Create a Version with the Endpoint Connection
Create a new version of your product and attach the endpoint connection to it.
Run a Test from the Dashboard
Select a test and run it against the version. Galtea calls your endpoint for each test case and records the inference results.
Step 1: Create an Endpoint Connection
Navigate to your product in the Dashboard and go to the Endpoint Connections section. Click New Endpoint Connection and configure the following:- Name — A descriptive name (e.g., “Production Chat API”).
- Type — Select
CONVERSATIONfor the primary request/response endpoint. - URL — The full URL of your AI endpoint (e.g.,
https://api.company.com/v1/chat). - HTTP Method — Typically
POST. - Authentication — Choose the auth type (
Bearer,API_KEY,Basic, orNone) and provide the token. - Input Template — A Jinja2 template that defines the request body Galtea will send.
- Output Mapping — JSONPath expressions that tell Galtea how to extract values from the response.
Input Template
The input template uses Jinja2 syntax with placeholders that Galtea fills automatically. At minimum, use{{ input.user_message }} to inject the test case input:
past_turns to include conversation history:
Output Mapping
The output mapping tells Galtea how to extract values from the API response using JSONPath expressions. Theoutput key is required:
output, retrieval_context, session_id, traces) is saved to the session metadata and becomes available as a {{ key }} placeholder in subsequent turns.
Sending an extracted value back (the round-trip)
Extracting a value is only half of stateful multi-turn handling. If your agent returns an identifier on the first turn — athread_id, conversation_id, or any token that groups subsequent messages — you must also reference it in the Input Template so Galtea sends it back on the next turn. Extraction alone stores the value but never resends it.
The round-trip has two coordinated sides:
- Turn 1 —
thread_idhas no value yet, so{{ thread_id }}renders as an empty string. Your agent creates a new thread and returns its id in the response. - Extraction — Output Mapping captures
$.thread_idinto session metadata. - Turn 2+ —
{{ thread_id }}now renders the captured id, so every following message is routed to the same thread.
See Templates & Mapping — State Management for the full reference on how extracted values are stored and reused across turns.
Step 2: Create a Version with the Endpoint Connection
Navigate to your product and create a new Version. When configuring the version:- Fill in the version name, model, and any other relevant properties.
- In the Conversation Endpoint Connection field, select the endpoint connection you created in Step 1.
If your AI system requires separate endpoints for session initialization or cleanup, you can optionally configure Initialization and Finalization endpoint connections. See Version — Multi-Step Session Lifecycle for details.
Step 3: Run a Test
Once your version is set up with an endpoint connection, you can run tests directly from the Dashboard:- Navigate to your product’s Tests section.
- Select the test you want to run.
- Choose the version with the configured endpoint connection.
- Start the test run.
Step 4: Evaluate the Results
After the inferences have been generated, you can trigger evaluations:- Navigate to the session results in the Dashboard.
- Select the Metrics you want to use for the evaluation.
- Run the evaluation.
Collecting Traces During Direct Inference
There are three ways to collect traces during Direct Inference:- Output Mapping (no code) — Extract traces from the API response using a
traceskey in your output mapping. - SDK
set_context(in your handler) — Pass{{ inference_result_id }}to your endpoint and use the SDK to create traces from within the handler. - W3C Trace Context Propagation (zero code) — Enable the
traceparentheader to automatically correlate your OTEL spans with Galtea inference results.
Option 1: Extract Traces via Output Mapping
If your endpoint returns trace data in its response, you can extract it using thetraces key in the output mapping. Galtea will store each trace object linked to the inference result automatically.
Example API response:
traces array and creates Trace entities linked to the inference result. Each object in the array must contain at least a name field and can include any Trace properties:
| Property | Type | Required | Description |
|---|---|---|---|
name | string | Yes | Name of the traced operation |
type | string | No | One of: SPAN, GENERATION, EVENT, AGENT, TOOL, CHAIN, RETRIEVER, EVALUATOR, EMBEDDING, GUARDRAIL |
description | string | No | Human-readable description of the operation |
inputData | object | No | Input parameters passed to the operation |
outputData | object | No | Result returned by the operation |
error | string | No | Error message if the operation failed |
latencyMs | number | No | Execution time in milliseconds |
metadata | object | No | Additional custom metadata |
startTime | string | No | ISO 8601 timestamp when the operation started |
endTime | string | No | ISO 8601 timestamp when the operation completed |
parentTraceId | string | No | ID of the parent trace for hierarchical relationships |
Option 2: Use set_context in Your Endpoint Handler
When running evaluations via Direct Inference, you can collect traces from your endpoint handler by linking the inference_result_id to your tracing context. Galtea automatically sends the X-Galtea-Inference-Id HTTP header with every Direct Inference request, so your endpoint can read it directly — no template changes needed.
Alternatively, you can pass {{ inference_result_id }} in the input template if you prefer to receive it in the request body.
1. Get the inference_result_id
From the HTTP header (recommended) — available automatically on every Direct Inference call:
2. Use set_context in Your Endpoint Handler
In your API endpoint, extract the inference_result_id from the request and use the SDK’s set_context / clear_context to associate traces with it:
@trace-decorated functions called while the context is active will be automatically linked to the inference result in Galtea.
For a complete guide on tracing setup, decorators, and context managers, see the Tracing Agent Operations tutorial.
Option 3: W3C Trace Context Propagation
If your service is instrumented with OpenTelemetry, you can automatically correlate your internal spans with Galtea inference results using the W3C Trace Context standard — no code changes required on your side.How it works
When enabled, Galtea creates a unique W3C trace ID for each direct inference call and injects atraceparent header into the outbound request to your endpoint. Your OTEL-instrumented service automatically creates child spans under that trace. The trace ID is also stored on the inference result for collector-side correlation.
1. Enable trace context propagation on your endpoint connection
In your Conversation endpoint connection, expand the Advanced Options section and scroll to Headers. Check the Enable W3C trace context propagation checkbox. This adds atraceparent header that Galtea will populate with the correct trace and span IDs on each inference call:
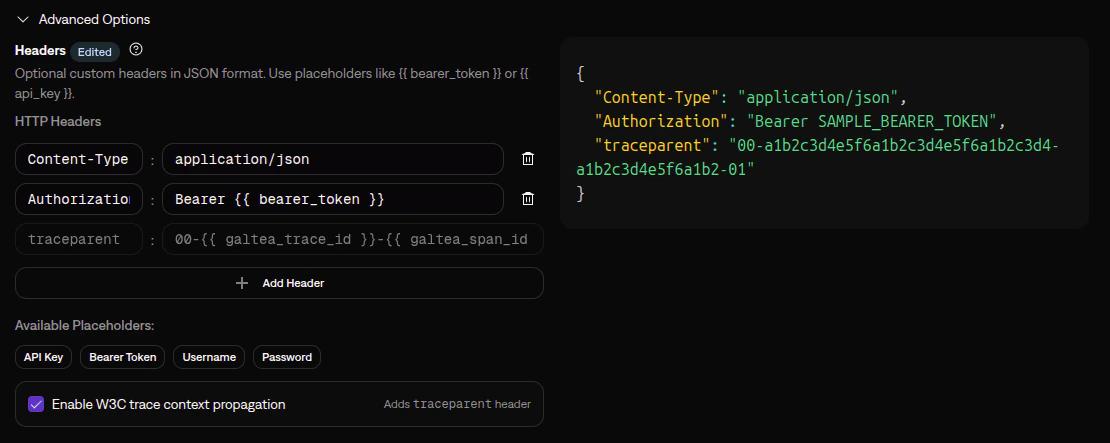
traceparent header is sent to your endpoint, and trace context is not propagated.
This option is only available for Conversation endpoint connections — the ones that handle inference calls. Initialization and Finalization endpoints are session lifecycle calls where trace correlation does not apply.
2. Configure your service for OTEL
Ensure your service has OpenTelemetry instrumentation enabled. Most frameworks support auto-instrumentation which requires no code changes:3. Point your OTEL exporter to the Galtea collector
Configure your OTEL exporter to send traces to the Galtea collector. Every request must carry anAuthorization: Bearer <Galtea-API-key> header — without it, the gateway returns 401 Unauthorized before the request reaches the collector.
All examples below use the Galtea platform hostname: otel.platform.prod-main.galtea.ai.
Using a dedicated tenant deployment?
Using a dedicated tenant deployment?
If your organization has a private Galtea deployment, replace the hostname with your tenant-specific endpoint:Your Galtea account team will provide the exact hostname during onboarding.
- Environment variables
- Python code
- OTel Collector
The OpenTelemetry SDK reads endpoint and headers from environment variables. Use shell substitution to expand The same
${GALTEA_API_KEY} before the value is stored in OTEL_EXPORTER_OTLP_TRACES_HEADERS:- HTTP (port 4318)
- gRPC (port 4317)
${GALTEA_API_KEY} syntax works inside a docker-compose.yml environment: block — Docker Compose performs the substitution before the container starts.Use
OTEL_EXPORTER_OTLP_TRACES_ENDPOINT (the per-signal variant), not OTEL_EXPORTER_OTLP_ENDPOINT. The base variable auto-appends /v1/traces to the URL, but the Galtea collector expects the /otel/traces path.Verify the endpoint accepts your key
A quick way to confirm the header is being applied correctly is to POST an empty payload and inspect the status code:4. Controlling how spans map to Trace records
When using the OTel Collector path, you can set Galtea-specific attributes on your spans to control how data maps to Trace records. If you don’t set any, spans are still ingested using the automatically mapped OTel fields. Galtea span attributes:| Attribute Key | Type | Maps To | Description |
|---|---|---|---|
galtea.trace.type | string | type | Trace type. One of: SPAN, GENERATION, EVENT, AGENT, TOOL, CHAIN, RETRIEVER, EVALUATOR, EMBEDDING, GUARDRAIL. |
galtea.trace.description | string | description | Human-readable description of the operation. Max 1MB. |
galtea.trace.input | string (JSON) | inputData | Input data, JSON-serialized. Max 10MB. |
galtea.trace.output | string (JSON) | outputData | Output data, JSON-serialized. Max 10MB. |
galtea.trace.error | string | error | Error message. Takes precedence over OTel span status error. |
galtea.trace.metadata | string (JSON) | metadata | Custom metadata, JSON-serialized. Max 10MB. |
galtea.inference_result.id | string | inferenceResultId | Explicitly links the span to an inference result. Only needed if the automatic traceId correlation does not apply (e.g., spans not originating from a Galtea direct inference call). |
span.name→namestartTimeUnixNano/endTimeUnixNano→startTime/endTime+latencyMs(computed)span.status→error(fallback whengaltea.trace.erroris not set; only forSTATUS_CODE_ERROR)parentSpanId→parentTraceId(parent-child hierarchy)
metadata field so no data is lost.
Learn More
Endpoint Connection
Full reference for configuring endpoint connections
Version
Learn about versions and how endpoint connections integrate with them
Evaluations
Understand how evaluations work
Metrics
Browse available metrics for evaluating your AI
Tracing Agent Operations
Capture and analyze your agent’s internal operations